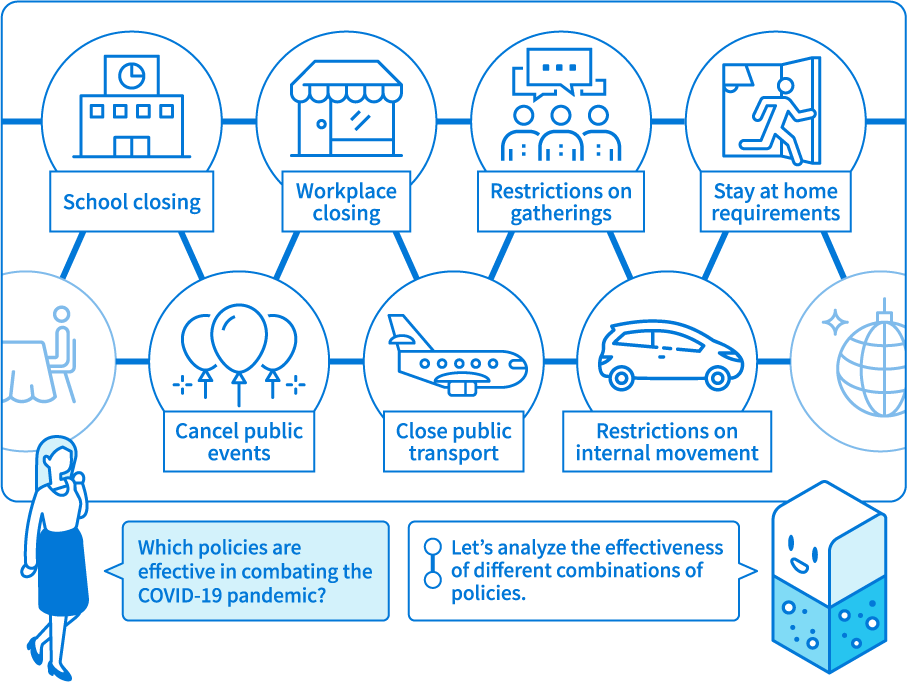
Embracing the challenge of discovering
effective policies for COVID-19
Use the Trial Tool to analyze the effectiveness of your country or region’s policies
This article describes how Wide Learning™ analytical functionality, which has been described in a number of other case studies to date, can be used to analyze the characteristics of countries and regions (generically referred to as “characteristics” in this article) along with a variety of implemented policies to discover combinations of policies that are effective at limiting growth in the number of COVID-19 infections when paired with those characteristics.
* This case study is based on data that was available as of August 2020.
Do efforts to stimulate economic activity cause the number of infections to rise?
Around the spring of 2020, the number of people infected with the novel coronavirus, COVID-19 began to surge worldwide. Infections subsequently continued to increase, spurring national and regional governments to undertake a variety of initiatives to bring the situation under control.
A global discussion followed as people questioned whether to impose restrictions on travel and economic activity in order to avoid the risk of infection or stimulate a stagnating economy. The backlash against a variety of restrictions adopted in response to a second wave of infections starting during the summer of 2020 was particularly intense in Europe, and the issue continues to be a major point of contention in European society as of this writing.
Policies promoting domestic travel in order to jump-start economic-activity have also generated significant interest in Japan, and most readers will be aware of the fact that these policies, while being welcomed by the tourism industry and related sectors, have prompted an outpouring of concern and news coverage. Artists in the entertainment industry, as well as their fans, may have wanted to see restrictions relaxed even earlier.
Are there regions where one policy has generated different results?
Examples of policies designed to limit growth in the number of infections through social distancing include closures of public transportation and requirements of staying at home.
How can the effectiveness of such policies be analyzed?
For example, some countries that imposed the same type of requirements of staying at home, for example Japan and New Zealand, saw little increase in infections, while others, for example the United States, India, and Brazil, saw the number of infections rise into the millions.
It's difficult to assess causal relationships.
Research to date has proposed factors that might be related to growth in the number of infections, including regional classification (Asia, Europe, etc.), BCG immunization rates, and per capita GDP.
In fact, the effectiveness of policies may depend on combinations of such characteristics, and the fact that various policies are implemented in combination raises the possibility of complex interrelationships and interactions.
Assessing how individual characteristics and policies are related to the limitation of infections is no simple task.
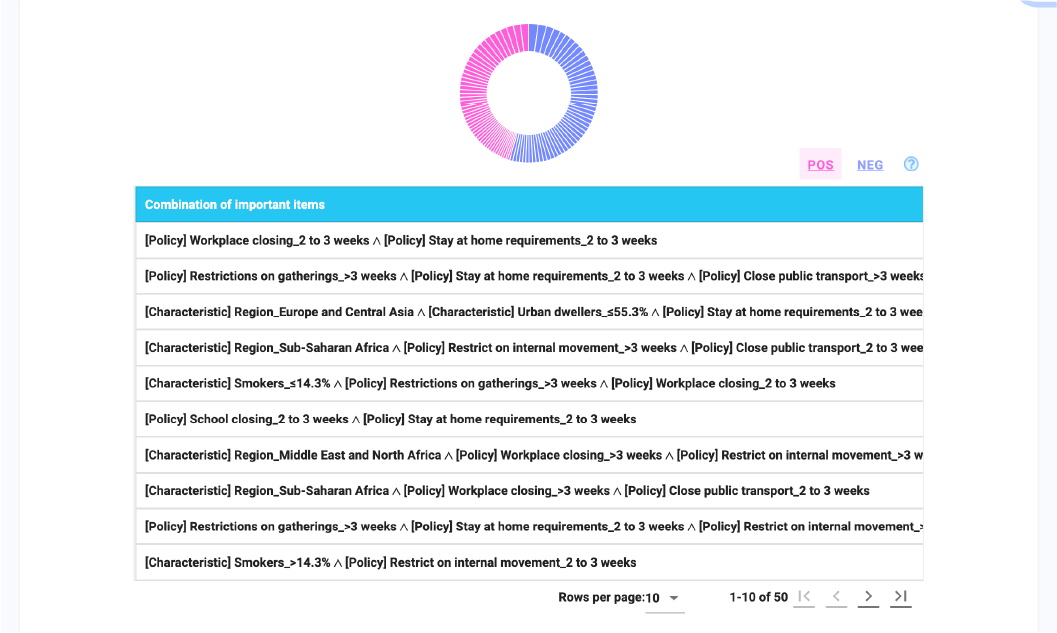
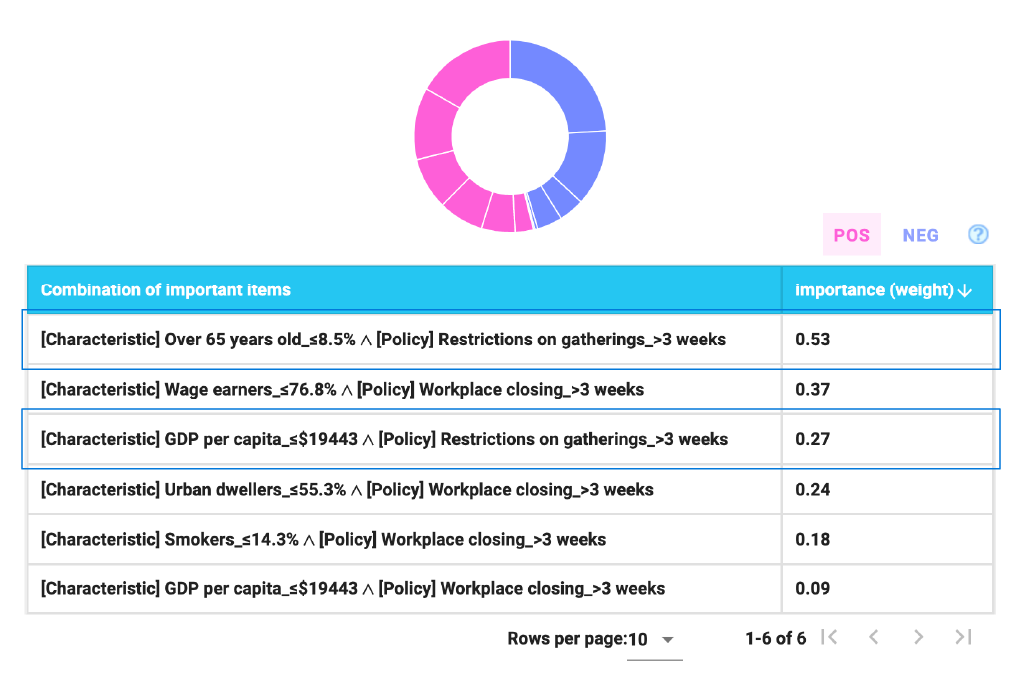
Discovering important combinations of characteristics and policies that are related to the limitation of infections
The number of possible combinations is given by 2n, where n is a number of foctors.
When dozens of factors are analyzed, the scales are difficult to process, even when computers are used.
(For more information, see Four Characteristics of Wide Learning™.)
Consequently, in most past research scientists have chosen a range of combinations to analyze in advance so that a smaller and more limited quantity of data can be analyzed.
However, such work requires a high level of specialized expertise, and past knowledge does not necessarily offer hints when addressing novel problems like COVID-19(*1).
As a result, important targets for investigation may be overlooked.
Wide Learning™ provides a method for quickly discovering clues from enormous sets of data.
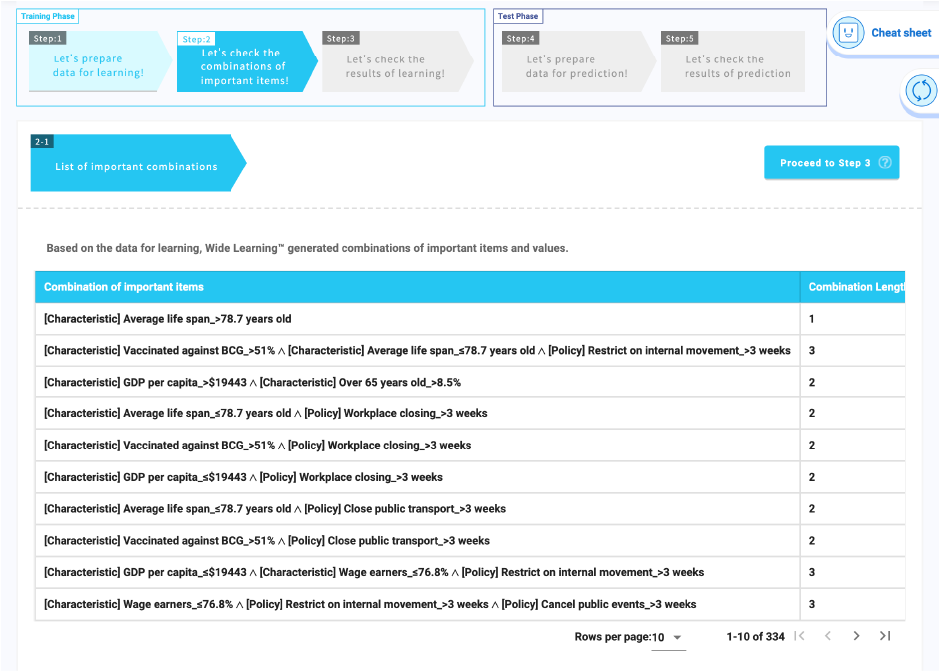
Wide Learning™ makes it possible to investigate combinations of astronomy-scale numbers of factors such as these and discover important combinations quickly by streamlining search order and facilitating effective use of intermediate search results.
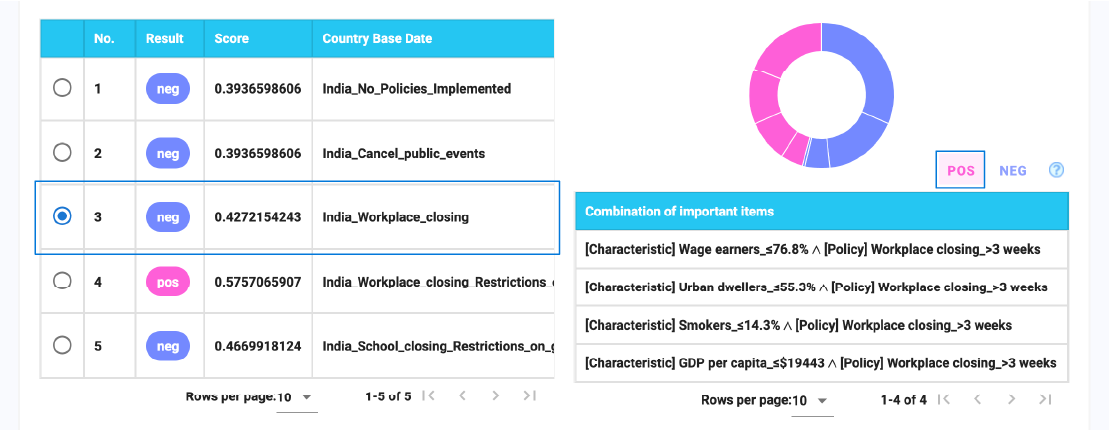
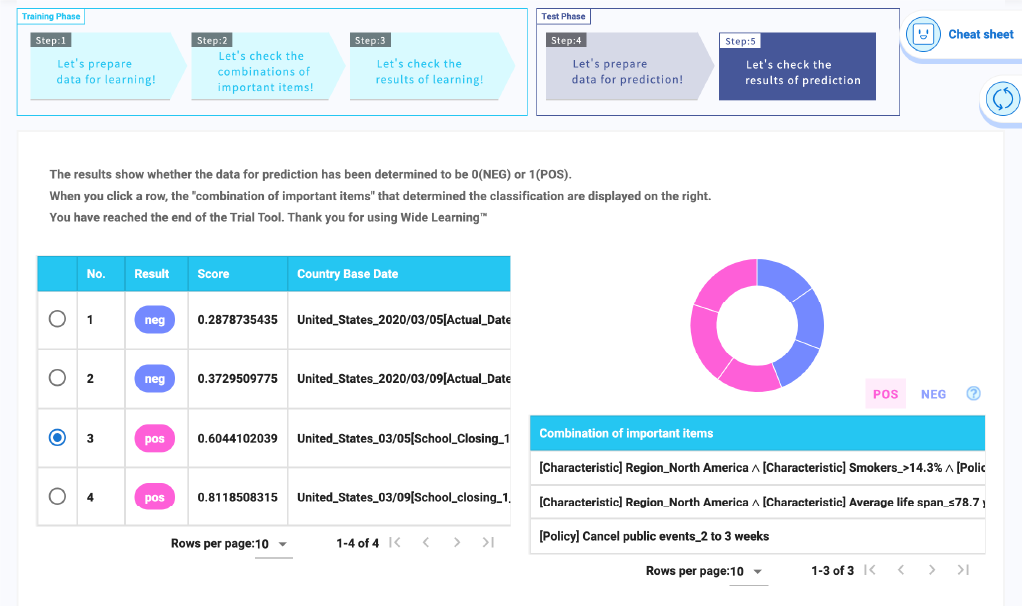
In this article, we will attempt to discover what combination of policies was associated with the increase in the number of infections in a country (region) with certain characteristics.
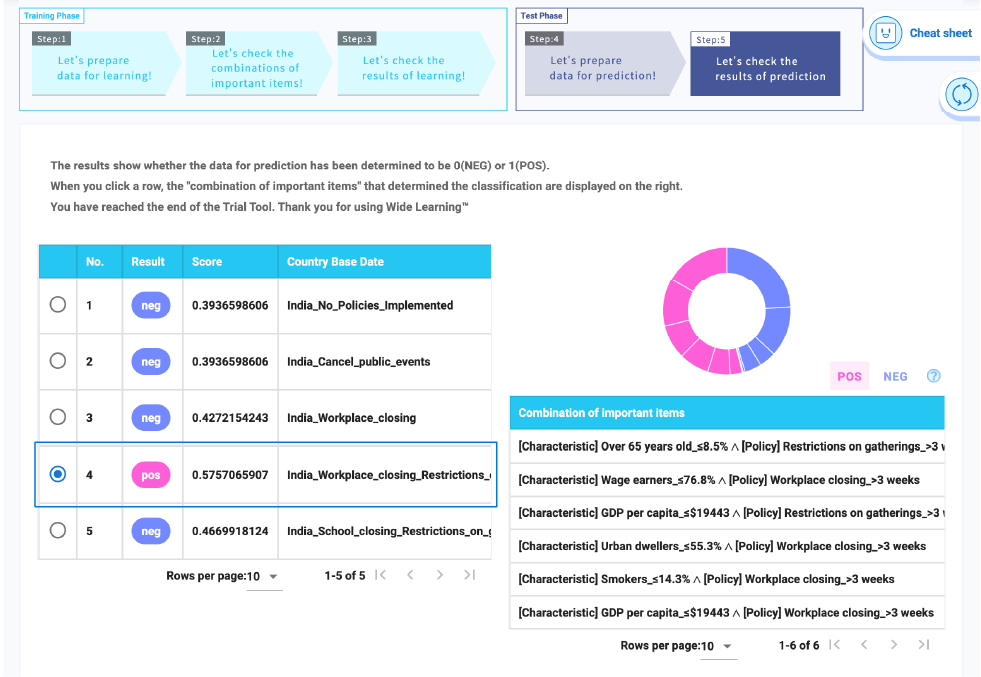
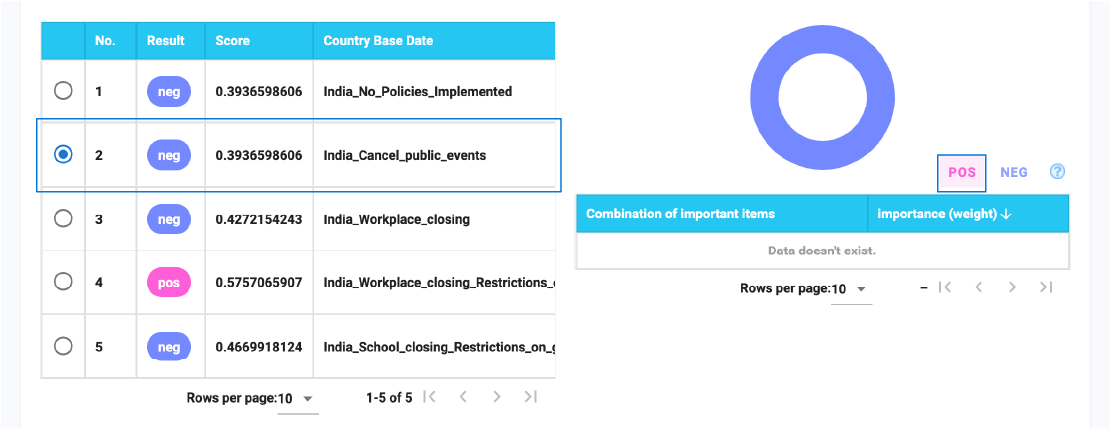
For this purpose, we will use the information about whether each region was able to limit growth in the number of infections during the identified period (1: POS [positive] or 0: NEG [negative]) as a solution label based on the rate of increase in the number of infections in each region, and we will make software learn the status of the above policies and characteristics.

*1 : The WHO has declared that “This virus is not SARS, it's not MERS, and it's not influenza. It is a unique virus with unique characteristics.”
Data used
The following data is necessary in order to use the Wide Learning™ Trial Tool. Please download the linked files.
Data for learning the software about policies for limiting growth in the number of infections:
Data for learning the Wide Learning™ system (COVID_train.csv)
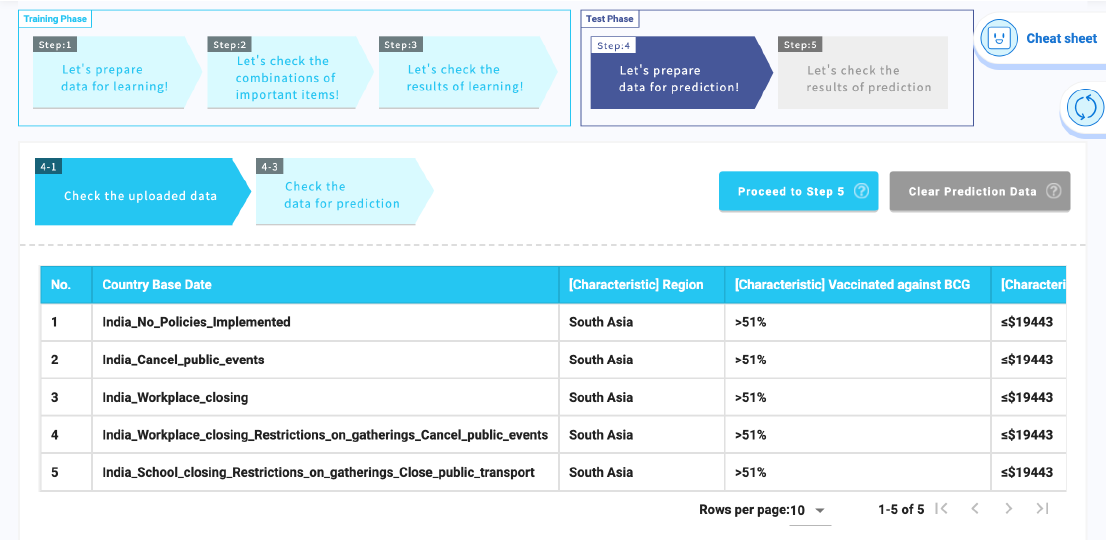
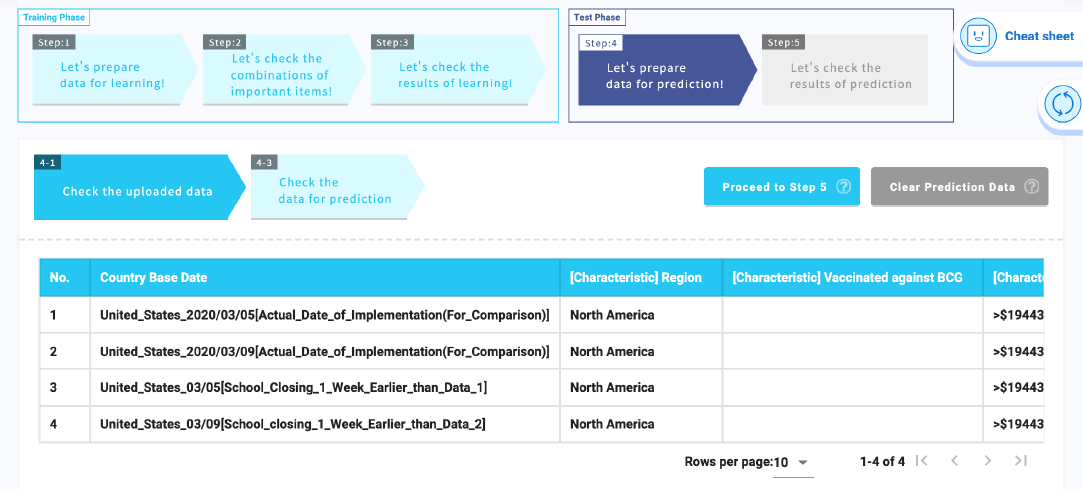
Data for forecasting policies for limiting growth in the number of infections:
Data A for facilitating Wide Learning™ forecasts: When previously unimplemented policies are implemented (COVID_test a_increment.csv)
Data for forecasting policies for limiting growth in the number of infections:
Data B for facilitating Wide Learning™ forecasts: When previously implemented policies are moved forward (COVID_test_b_advance.csv)
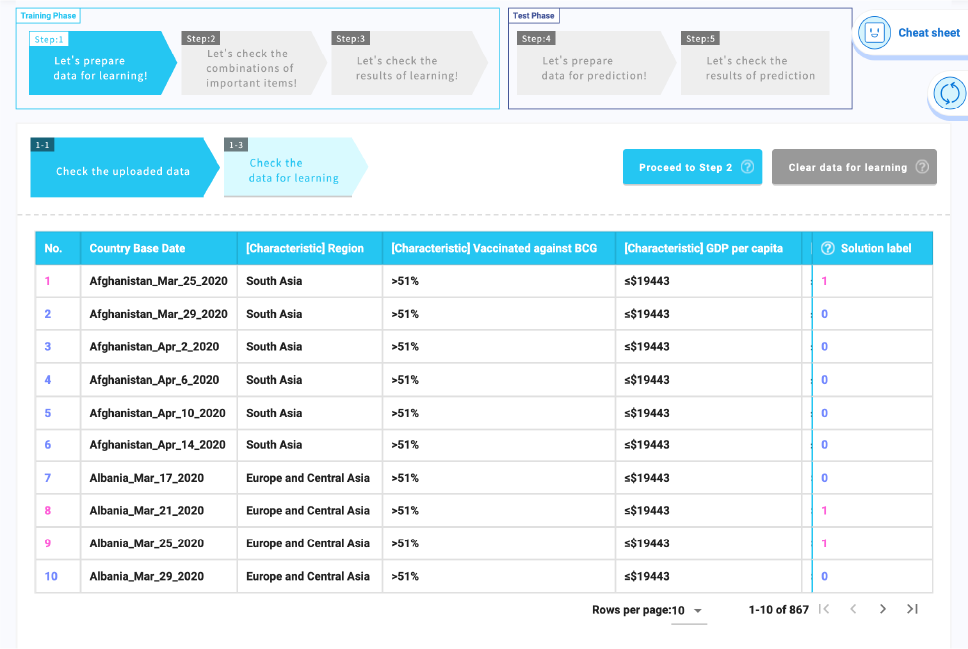
Table 1 below summarizes characteristics and policy implementation status aggregated from publicly available data for the U.S. as of March 25, 2020. Before and after data for the surge in the number of infections in various countries and regions worldwide can be collected every 4 days as a base date and used to perform analyses with Wide Learning™.
| Data label | Country Base Date日 | United_States_Mar_25_2020 |
|---|---|---|
| Predictor variable | [Characteristic] Region | North America |
| [Characteristic] Vaccinated against BCG | ― | |
| [Characteristic] GDP per capita | >$19443 | |
| [Characteristic] Over 65 years old | >8.5% | |
| [Characteristic] Average life span | ≤78.7 years old | |
| [Characteristic] Smokers | >14.3% | |
| [Characteristic] Urban dwellers | >55.3% | |
| [Characteristic] Wage earners | >76.8% | |
| [Policy] School closing | >3 weeks | |
| [Policy] Restrictions on gatherings | 2 to 3 weeks | |
| [Policy] Workplace closing | 2 to 3 weeks | |
| [Policy] Stay at home requirements | >3 weeks | |
| [Policy] Restrictions on internal movement | >3 weeks | |
| [Policy] Close public transport | >3 weeks | |
| [Policy] Cancel public events | >3 weeks | |
| Response variable | Solution label | 1 |
Data details

The predictor variable for policies (“2 to 3 weeks/>3 weeks”) was created to serve as an indicator for determining whether the policy in question impacted infections within one week of its implementation or after that period, based on the assumption that the incubation period that follows infection before the onset of symptoms means that about two weeks elapse before a given patient generates a positive test result.
Data about the policy implementation status for various countries and regions, the number of infections reported, and national/regional characteristics was drawn from the Oxford University COVID-19 Government Response Tracker(*2).
Indicator data from the World Bank(*3)was also used to assess national and regional characteristics.
For more information about data and how to create response variables, see the Supplemental Explanation at the end of this article as well as information from the list of related sources.
*2 : Oxford Covid-19 Government Response Tracker (OxCGRT)
*3 : Indicators - World Bank Open Data


 0.4817
 -0.0709